File:2016 Pacific typhoon season summary.png
原本檔案 (4,000 × 3,000 像素,檔案大細:7.7 MB ,MIME類型:image/png)
摘要
| 描述 |
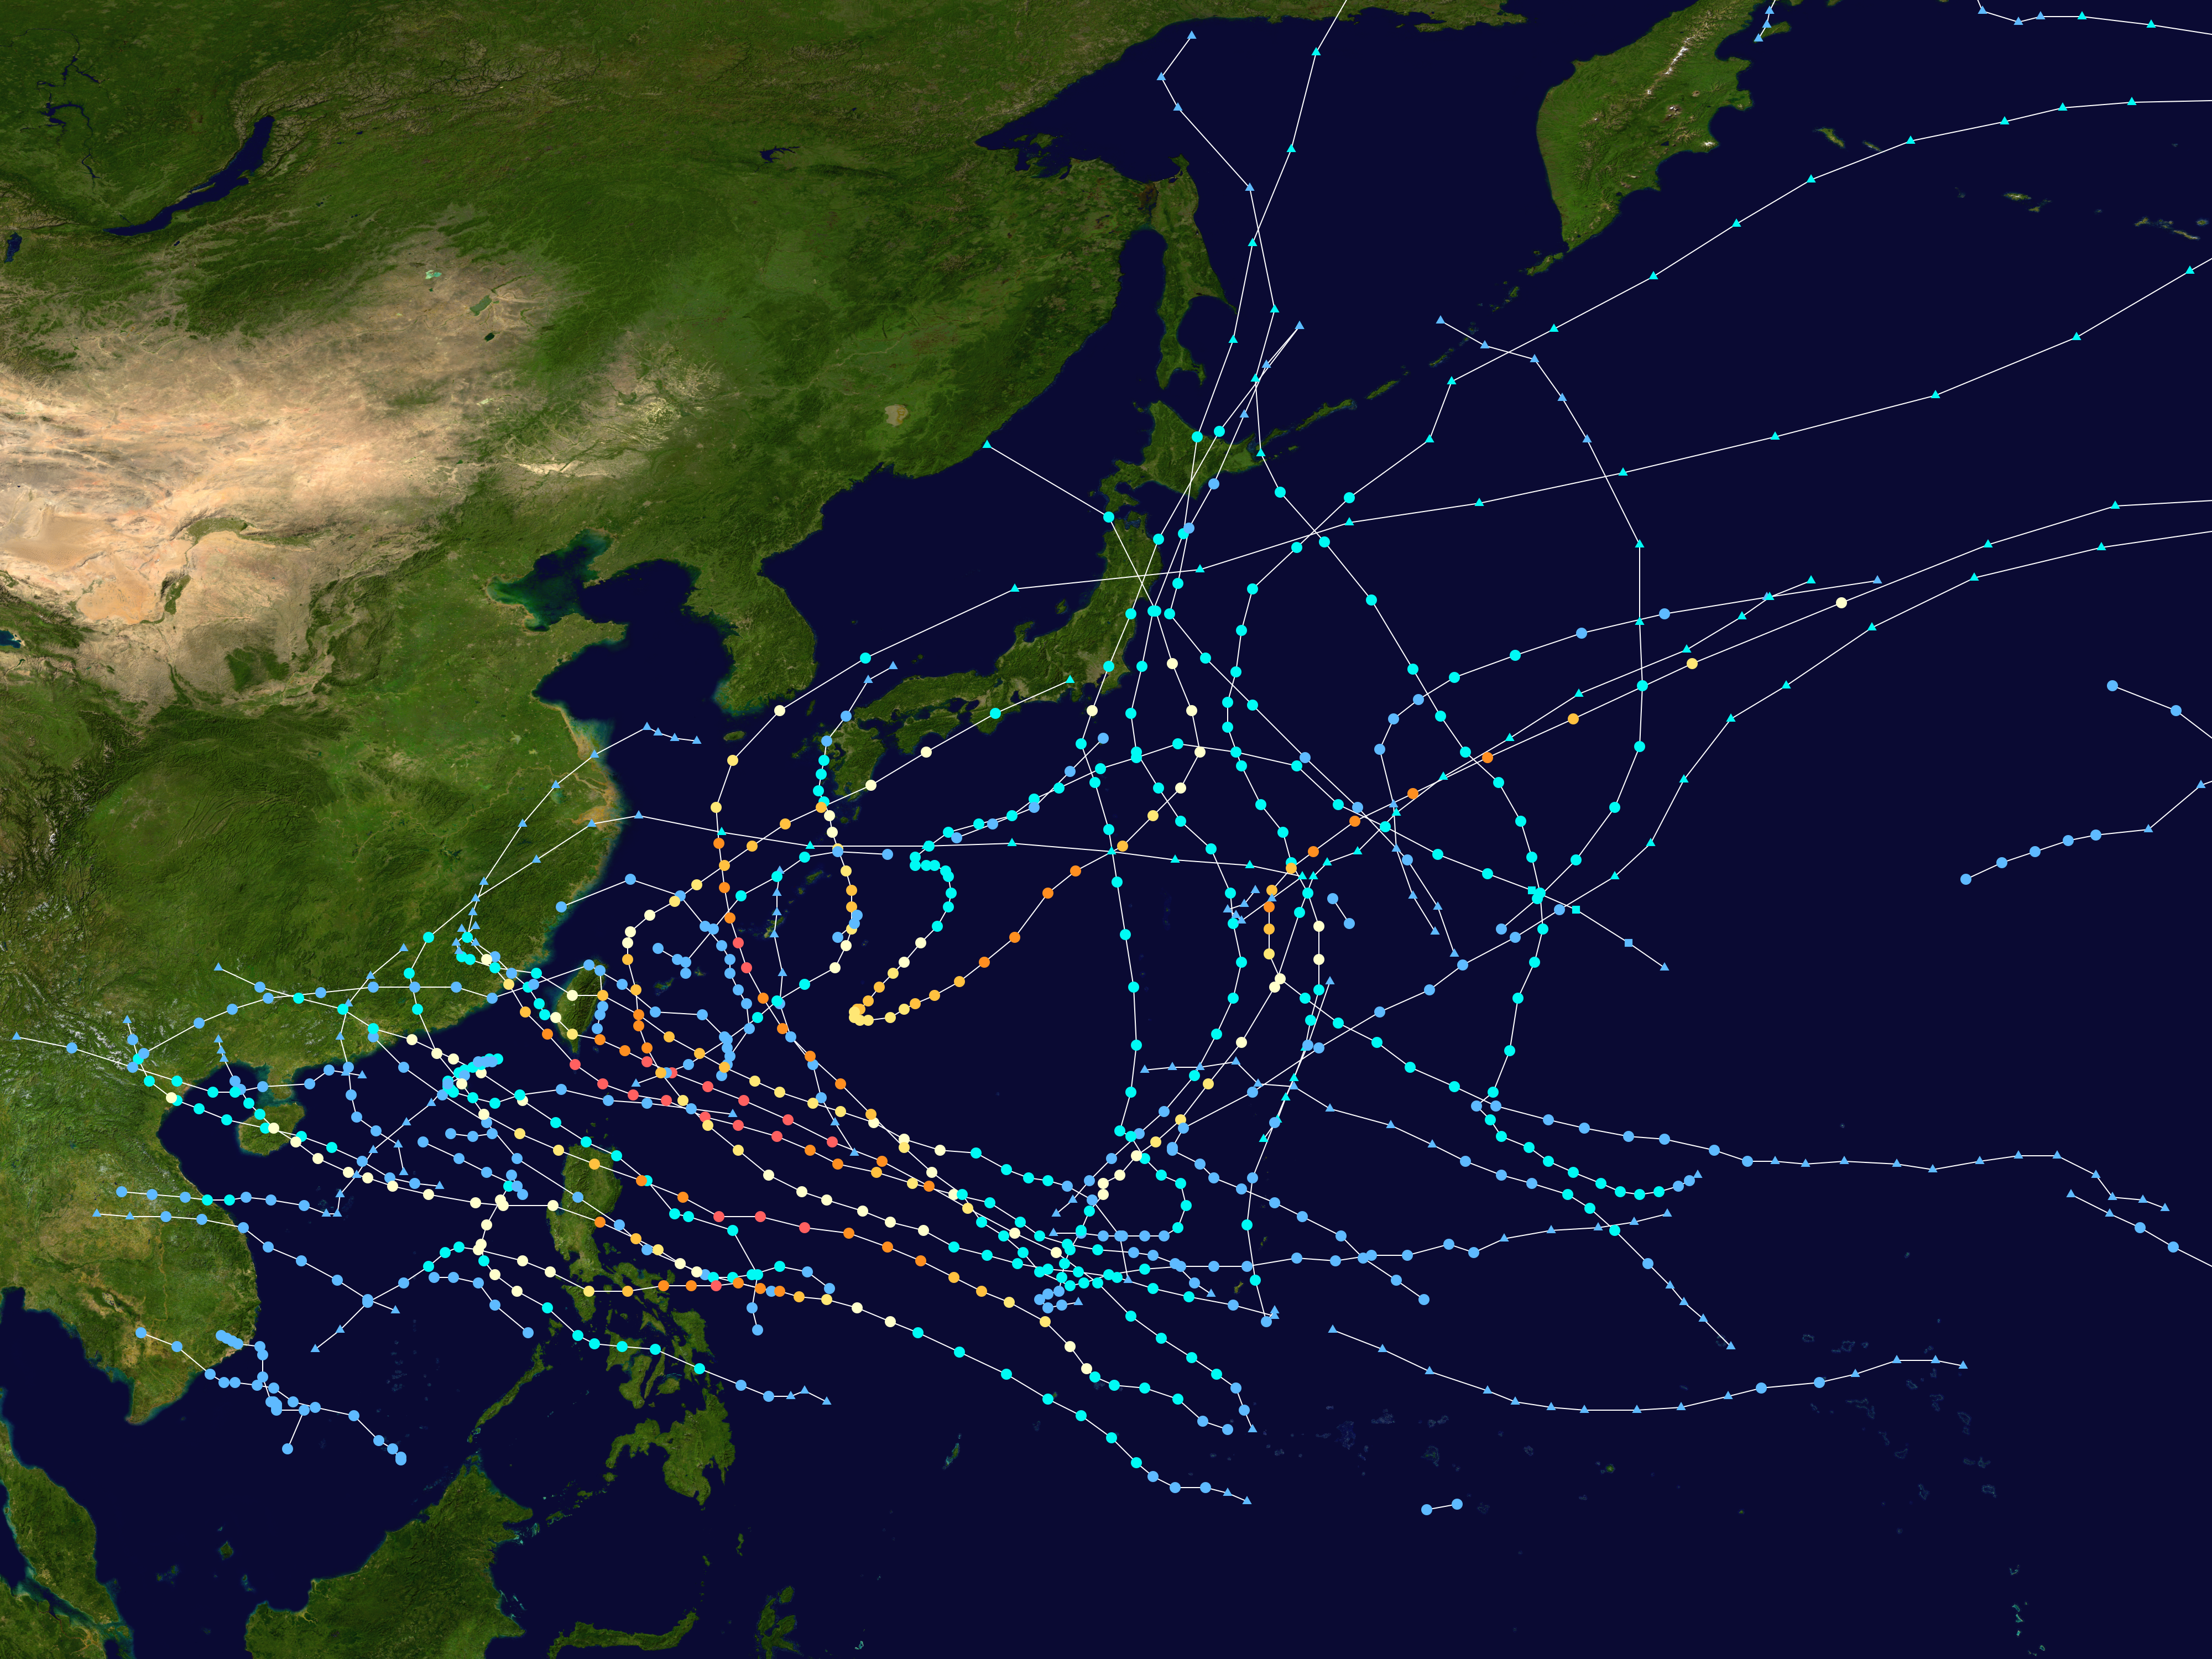
English: This map shows the tracks of all tropical cyclones in the 2016 Pacific typhoon season. The points show the location of each storm at 6-hour intervals. The colour represents the storm's maximum sustained wind speeds as classified in the Saffir-Simpson Hurricane Scale (see below), and the shape of the data points represent the type of the storm.
Tropical depression (≤38 mph, ≤62 km/h)
Tropical storm (39–73 mph, 63–118 km/h)
Category 1 (74–95 mph, 119–153 km/h)
Category 2 (96–110 mph, 154–177 km/h)
Category 3 (111–129 mph, 178–208 km/h)
Category 4 (130–156 mph, 209–251 km/h)
Category 5 (≥157 mph, ≥252 km/h)
Unknown
Storm type |
| 來源 | Created using Wikipedia:WikiProject Tropical cyclones/Tracks. The background image is from NASA [1]. The tracking data is from the Joint Typhoon Warning Center's best track database |
| 作者 | Supportstorm |
| This work has been released into the public domain by its author, Supportstorm. This applies worldwide. In some countries this may not be legally possible; if so: Supportstorm grants anyone the right to use this work for any purpose, without any conditions, unless such conditions are required by law. |
檔案歷史
撳個日期/時間去睇響嗰個時間出現過嘅檔案。
| 日期/時間 | 縮圖 | 尺寸 | 用戶 | 註解 | |
|---|---|---|---|---|---|
| 現時 | 2020年2月16號 (日) 02:50 | | 4,000 × 3,000(7.7 MB) | Supportstorm | Primarily JTWC/JMA data |
| 2018年12月9號 (日) 05:29 |  | 4,000 × 3,400(10.42 MB) | Supportstorm | Reverted to version as of 05:01, 16 March 2018 (UTC) | |
| 2018年8月30號 (四) 16:23 |  | 4,000 × 3,000(9.98 MB) | David Petrovsky | Added also features known as the dimensions and size | |
| 2018年3月16號 (五) 05:01 |  | 4,000 × 3,400(10.42 MB) | Supportstorm | Best track update | |
| 2017年5月14號 (日) 06:45 |  | 4,000 × 2,942(8.26 MB) | Supportstorm | Reverted to version as of 21:26, 22 February 2017 (UTC) | |
| 2017年4月28號 (五) 03:22 |  | 4,000 × 3,375(10.3 MB) | Morgan Siu | ||
| 2017年2月22號 (三) 21:26 |  | 4,000 × 2,942(8.26 MB) | Supportstorm | Update (JMA weather map reanalysis up to October 31) | |
| 2016年12月23號 (五) 09:17 |  | 4,000 × 3,375(10.3 MB) | Supportstorm | Update (JMA weather map reanalysis up to August 31) | |
| 2016年11月15號 (二) 13:43 |  | 4,000 × 3,375(10.26 MB) | Supportstorm | Update | |
| 2016年10月30號 (日) 01:19 |  | 4,000 × 3,375(10.14 MB) | Supportstorm | Update |
檔案用途
以下嘅1版用到呢個檔:
全域檔案使用情況
下面嘅維基都用緊呢個檔案:
- bcl.wikipedia.org嘅使用情況
- de.wikipedia.org嘅使用情況
- en.wikipedia.org嘅使用情況
- 2016 Pacific typhoon season
- Timeline of the 2016 Pacific typhoon season
- Template:2016 Pacific typhoon season buttons
- Typhoon Nepartak
- Tropical Storm Mirinae (2016)
- Tropical Storm Nida (2016)
- Tropical Storm Dianmu (2016)
- Typhoon Mindulle (2016)
- Typhoon Lionrock
- User:Nino Marakot/2016 Pacific typhoon season
- Typhoon Meranti
- Typhoon Malakas (2016)
- Tropical Storm Rai (2016)
- Typhoon Megi (2016)
- Typhoon Chaba (2016)
- Typhoon Songda (2016)
- Typhoon Sarika
- Typhoon Haima
- November 2016 Vietnam tropical depression
- Tropical Storm Aere (2016)
- User:Typhoon2013/PTS Format 1A
- Typhoon Nock-ten
- User:Tfmbty/2016 Pacific typhoon season
- Tropical cyclones in 2016
- User:HUYTK21
- es.wikipedia.org嘅使用情況
- ja.wikipedia.org嘅使用情況
- ko.wikipedia.org嘅使用情況
- pt.wikipedia.org嘅使用情況
- th.wikipedia.org嘅使用情況
- tl.wikipedia.org嘅使用情況
- vi.wikipedia.org嘅使用情況
- www.wikidata.org嘅使用情況
- zh.wikipedia.org嘅使用情況
睇呢個檔案嘅更多全域使用情況。