File:Circle with overlapping manifold charts.svg

呢個「SVG」檔案嘅呢個「PNG」預覽嘅大細:300 × 300 像素。 第啲解像度:240 × 240 像素|480 × 480 像素|768 × 768 像素|1,024 × 1,024 像素|2,048 × 2,048 像素。
原本檔案 (SVG檔案,表面大細: 300 × 300 像素,檔案大細:15 KB)
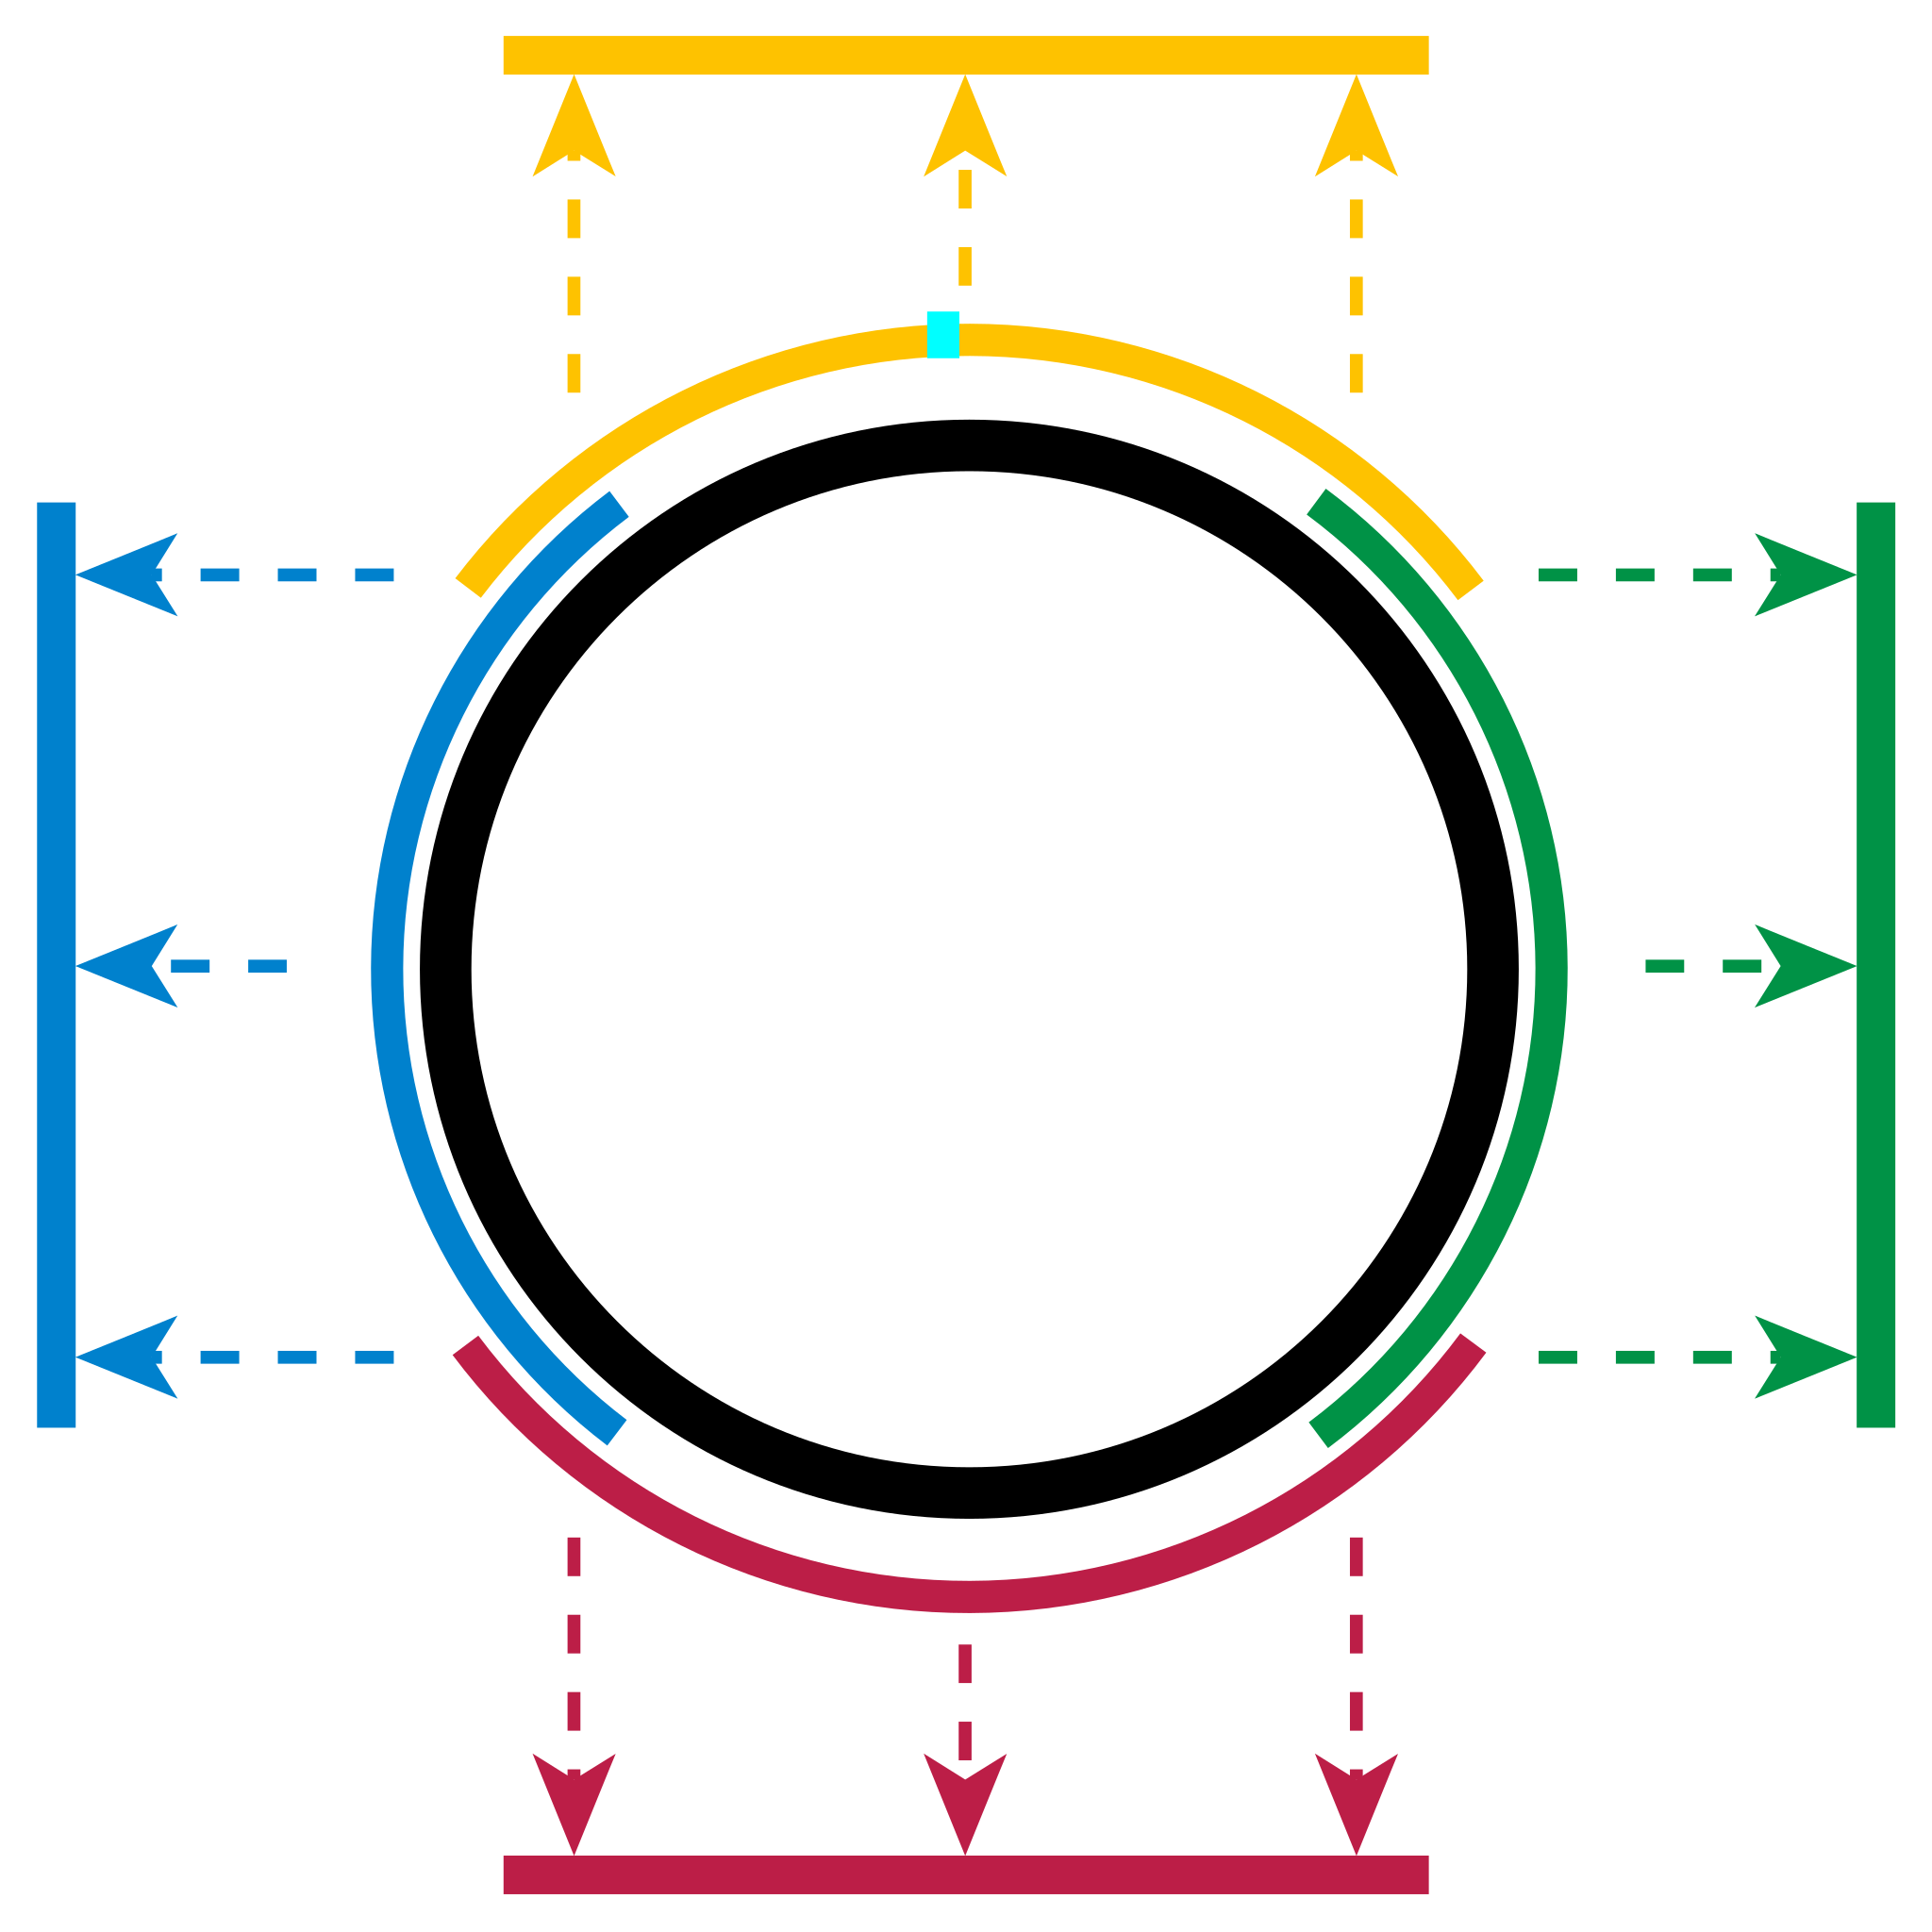
| 描述 | Circle with example manifold charts, showing four overlapping half-space projections: top (+y), bottom (−y), left (−x), right (+x) |
| 日期 | (UTC) |
| 來源 | |
| 作者 |
|
| This is a retouched picture, which means that it has been digitally altered from its original version. Modifications: Redrawn to SVG format; resized. The original can be viewed here: Circle with overlapping manifold charts.png:
|
呢個檔案用共享創意 姓名標示-非商業性-相同方式分享3.0 未本地化版本條款授權。
- 你可以:
- 去分享 – 複製、發佈同傳播呢個作品
- 再改 – 創作演繹作品
- 要遵照下面嘅條件:
- 署名 – 你一定要畀合適嘅表彰、畀返指向呢個授權條款嘅連結,同埋寫明有無改過嚟。你可以用任何合理方式去做,但唔可以用任何方式暗示授權人認可咗你或者你嘅使用方式。
- 相同方式分享 – 如果你用任何方式改過呢個作品,你必須要用返原本或者相似嘅條款發佈。
Original upload log
This image is a derivative work of the following images:
- Image:Circle_with_overlapping_manifold_charts.png licensed with Cc-by-sa-2.5
- 2005-08-01T19:18:49Z KSmrq 1000x1000 (51024 Bytes) {{cc-by-sa-2.5}} PNG file created as SVG, rendered by Batik, and uploaded by author. Circle with example manifold charts, showing four, overlapping, half-space projections: top (+y), bottom (-y), left (-x), right (+x). [[C
Uploaded with derivativeFX
檔案歷史
撳個日期/時間去睇響嗰個時間出現過嘅檔案。
| 日期/時間 | 縮圖 | 尺寸 | 用戶 | 註解 | |
|---|---|---|---|---|---|
| 現時 | 2008年7月10號 (四) 20:30 | | 300 × 300(15 KB) | Pbrks | {{Information |Description=Circle with example manifold charts, showing four overlapping half-space projections: top (+y), bottom (−y), left (−x), right (+x) |Source=*Image:Circle_with_overlapping_manifold_charts.png |Date=2008-07-10 20:29 (UTC) |
檔案用途
以下嘅1版用到呢個檔:
全域檔案使用情況
下面嘅維基都用緊呢個檔案:
- ar.wikipedia.org嘅使用情況
- ca.wikipedia.org嘅使用情況
- el.wikipedia.org嘅使用情況
- en.wikipedia.org嘅使用情況
- en.wikiversity.org嘅使用情況
- fa.wikipedia.org嘅使用情況
- gl.wikipedia.org嘅使用情況
- id.wikipedia.org嘅使用情況
- it.wikipedia.org嘅使用情況
- ko.wikipedia.org嘅使用情況
- nl.wikipedia.org嘅使用情況
- no.wikipedia.org嘅使用情況
- pl.wikipedia.org嘅使用情況
- pt.wikipedia.org嘅使用情況
- th.wikipedia.org嘅使用情況