File:Folio Plot BCG Matrix Example.png

原本檔案 (2,816 × 2,840 像素,檔案大細:75 KB ,MIME類型:image/png)
摘要
| 描述 |
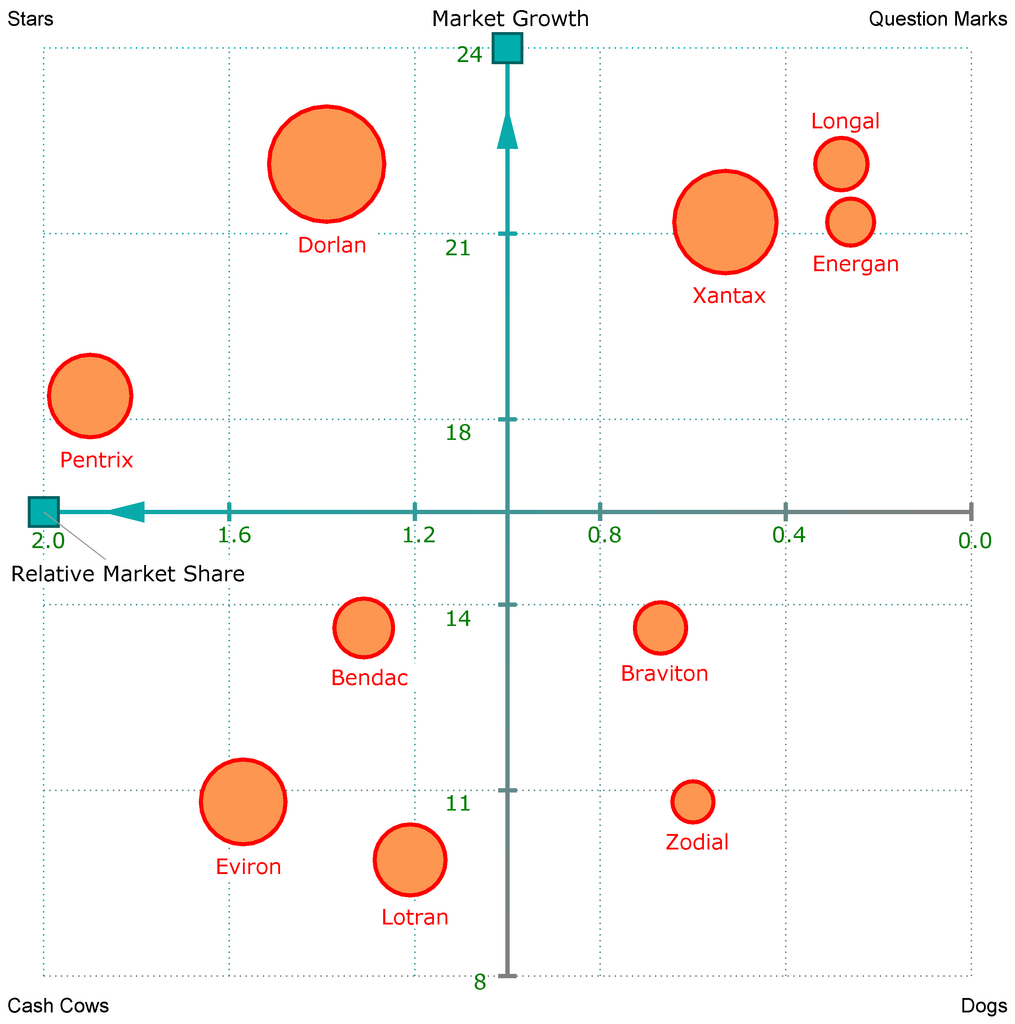
English: Folio plot of a BCG matrix analysis using an example data set. The folio plot visualizes the relative market share of a portfolio (hence the name) of products versus the growth of their market. The measurements are visualized as squares, and the objects as circles that differ in size by their sales volume. The PNG was created with Foliomap. |
| 日期 | |
| 來源 | Template:Ericmelse |
| 作者 | Ericmelse |
協議
我,呢份作品嘅作者,決定用以下許可發佈呢件作品:
Ĉi tiu dosiero estas disponebla laŭ la permesilo Krea Komunaĵo Atribuite 3.0 Neadaptita.
- 你可以:
- 去分享 – 複製、發佈同傳播呢個作品
- 再改 – 創作演繹作品
- 要遵照下面嘅條件:
- 署名 – 你一定要畀合適嘅表彰、畀返指向呢個授權條款嘅連結,同埋寫明有無改過嚟。你可以用任何合理方式去做,但唔可以用任何方式暗示授權人認可咗你或者你嘅使用方式。
檔案歷史
撳個日期/時間去睇響嗰個時間出現過嘅檔案。
| 日期/時間 | 縮圖 | 尺寸 | 用戶 | 註解 | |
|---|---|---|---|---|---|
| 現時 | 2010年2月22號 (一) 12:40 | | 2,816 × 2,840(75 KB) | Ericmelse | {{Information |Description={{en|1=Folio plot of a BCG Matrix Analysis using an example data set. The folio plot visualizes the relative market share of a portfolio (hence the name) of products versus the growth of their market. The measurements are visual |
檔案用途
全域檔案使用情況
下面嘅維基都用緊呢個檔案:
- ca.wikipedia.org嘅使用情況
- en.wikipedia.org嘅使用情況
- fa.wikipedia.org嘅使用情況
- he.wikipedia.org嘅使用情況
- hy.wikipedia.org嘅使用情況
- id.wikipedia.org嘅使用情況
- ja.wikipedia.org嘅使用情況
- ko.wikipedia.org嘅使用情況
- la.wikipedia.org嘅使用情況
- ms.wikipedia.org嘅使用情況
- sv.wikipedia.org嘅使用情況
- th.wikipedia.org嘅使用情況
- uk.wikipedia.org嘅使用情況
- zh.wikipedia.org嘅使用情況