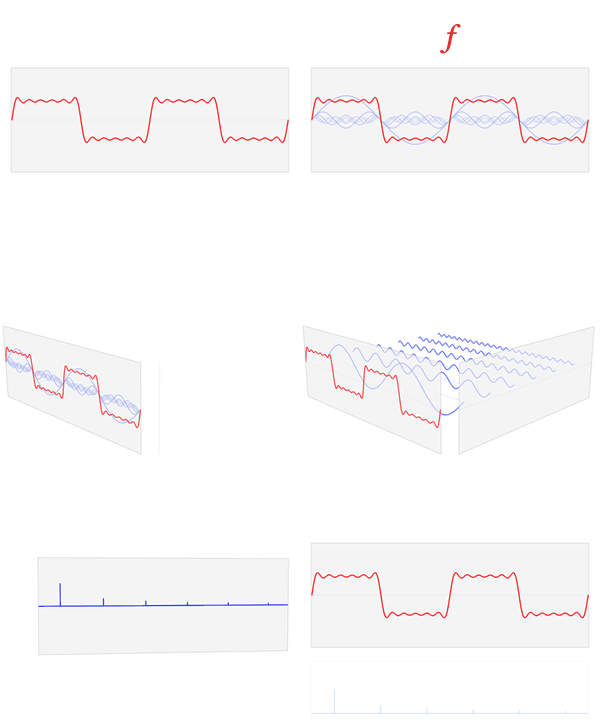
File:Fourier transform time and frequency domains (small).gif
Fourier_transform_time_and_frequency_domains_(small).gif (300 × 240 像素,檔案大細:265 KB ,MIME類型:image/gif、循環、93格、37 s)
檔案歷史
撳個日期/時間去睇響嗰個時間出現過嘅檔案。
| 日期/時間 | 縮圖 | 尺寸 | 用戶 | 註解 | |
|---|---|---|---|---|---|
| 現時 | 2013年2月23號 (六) 20:44 |  | 300 × 240(265 KB) | LucasVB | {{Information |Description={{en|1=A visualization of the relationship between the time domain and the frequency domain of a function, based on its Fourier transform. The Fourier transform takes an input function f (in red) in the "time domain" and con... |
檔案用途
全域檔案使用情況
下面嘅維基都用緊呢個檔案:
- ar.wikipedia.org嘅使用情況
- ast.wikipedia.org嘅使用情況
- ca.wikipedia.org嘅使用情況
- de.wikipedia.org嘅使用情況
- el.wikipedia.org嘅使用情況
- en.wikipedia.org嘅使用情況
- en.wikibooks.org嘅使用情況
- es.wikipedia.org嘅使用情況
- es.wikibooks.org嘅使用情況
- et.wikipedia.org嘅使用情況
- fa.wikipedia.org嘅使用情況
- fa.wikibooks.org嘅使用情況
- he.wikipedia.org嘅使用情況
- ja.wikipedia.org嘅使用情況
- ko.wikipedia.org嘅使用情況
- www.mediawiki.org嘅使用情況
- mr.wikipedia.org嘅使用情況
- ms.wikipedia.org嘅使用情況
- nl.wikipedia.org嘅使用情況
- pt.wikipedia.org嘅使用情況
- pt.wikiversity.org嘅使用情況
- ru.wikipedia.org嘅使用情況
- simple.wikipedia.org嘅使用情況
- sq.wikipedia.org嘅使用情況
- tt.wikipedia.org嘅使用情況
- uk.wikipedia.org嘅使用情況
睇呢個檔案嘅更多全域使用情況。

