File:Human welfare and ecological footprint.jpg

預覽大細:800 × 491 像素。 第啲解像度:320 × 197 像素|640 × 393 像素|850 × 522 像素。
原本檔案 (850 × 522 像素,檔案大細:182 KB ,MIME類型:image/jpeg)

|
This chart image could be recreated using vector graphics as an SVG file. This has several advantages; see Commons:Media for cleanup for more information. If an SVG form of this image is already available, please upload it. After uploading an SVG, replace this template with {{vector version available|new image name.svg}}.
|


摘要
| 描述 |
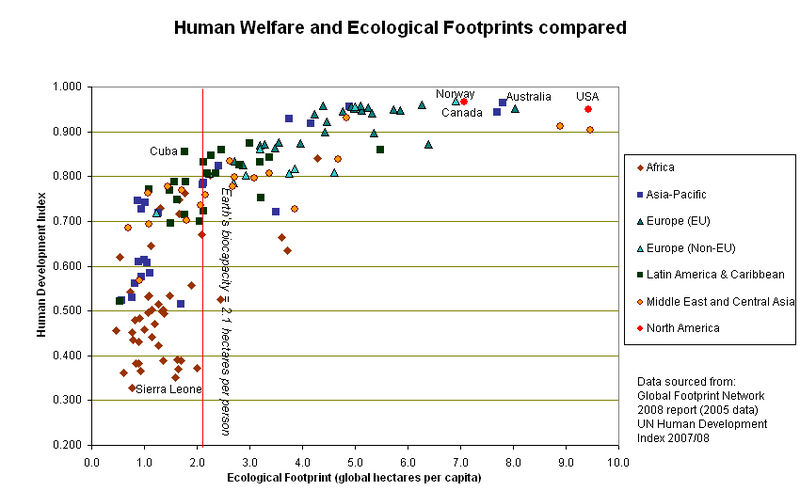
English: Graph showing ecological footprints of nations along with the Human Development Index (a measure of quality of life) |
| 日期 | |
| 來源 | 自己作品 |
| 作者 | Travelplanner based on data from UN Development Programme and Global Footprint Network |
| Other versions | Human_welfare_and_ecological_footprint_sustainability.jpg, shows criteria for sustainability as a shaded area. |
協議
I, the copyright holder of this work, hereby publish it under the following licenses:
呢個檔案用共享創意 姓名標示-非商業性-相同方式分享3.0 未本地化版本條款授權。
- 你可以:
- 去分享 – 複製、發佈同傳播呢個作品
- 再改 – 創作演繹作品
- 要遵照下面嘅條件:
- 署名 – 你一定要畀合適嘅表彰、畀返指向呢個授權條款嘅連結,同埋寫明有無改過嚟。你可以用任何合理方式去做,但唔可以用任何方式暗示授權人認可咗你或者你嘅使用方式。
- 相同方式分享 – 如果你用任何方式改過呢個作品,你必須要用返原本或者相似嘅條款發佈。

|
根據自由軟體基金會發佈嘅無固定段落、封面文字同封底文字GNU自由文件授權條款第1.2或打後嘅版本,你獲授權可以重製、散佈同埋修改爾份文件。授權條款嘅副本喺章節GNU自由文件授權條款。 |
你可以揀你想用嘅牌照。
檔案歷史
撳個日期/時間去睇響嗰個時間出現過嘅檔案。
| 日期/時間 | 縮圖 | 尺寸 | 用戶 | 註解 | |
|---|---|---|---|---|---|
| 現時 | 2009年4月27號 (一) 09:02 | | 850 × 522(182 KB) | Travelplanner | {{Information |Description={{en|1=Graph showing ecological footprints of nations along with the Human Development Index (a measure of quality of life)}} |Source=Own work by uploader |Author=Travelplannerbased on data from UN Develop |
檔案用途
以下嘅1版用到呢個檔:
全域檔案使用情況
下面嘅維基都用緊呢個檔案:
- an.wikipedia.org嘅使用情況
- en.wikipedia.org嘅使用情況
- es.wikipedia.org嘅使用情況
- fi.wikipedia.org嘅使用情況
- fr.wikipedia.org嘅使用情況
- hi.wikipedia.org嘅使用情況
- hu.wikipedia.org嘅使用情況
- hy.wikipedia.org嘅使用情況
- ms.wikipedia.org嘅使用情況
- pl.wikipedia.org嘅使用情況
- simple.wikipedia.org嘅使用情況