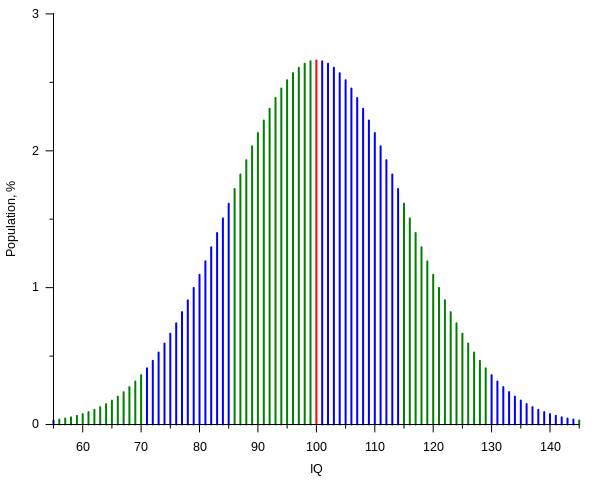
File:IQ curve.svg

呢個「SVG」檔案嘅呢個「PNG」預覽嘅大細:600 × 480 像素。 第啲解像度:300 × 240 像素|960 × 768 像素|1,280 × 1,024 像素|2,560 × 2,048 像素。
原本檔案 (SVG檔案,表面大細: 600 × 480 像素,檔案大細:9 KB)
檔案歷史
撳個日期/時間去睇響嗰個時間出現過嘅檔案。
| 日期/時間 | 縮圖 | 尺寸 | 用戶 | 註解 | |
|---|---|---|---|---|---|
| 現時 | 2020年11月26號 (四) 23:11 |  | 600 × 480(9 KB) | Paranaja | Reverted to version as of 21:27, 2 November 2012 (UTC) |
| 2012年11月2號 (五) 21:27 |  | 600 × 480(9 KB) | Mikhail Ryazanov | IQ values are now integers; gnuplot-only approach | |
| 2006年12月6號 (三) 09:20 |  | 600 × 480(12 KB) | Alejo2083 | {{Information |Description= The IQ test is made so that most of the people will score 100 and the distribution will have the shape of a Gaussian function, with a standard deviation of 15. The plot shows the percentage of people getting a score versus the |
檔案用途
全域檔案使用情況
下面嘅維基都用緊呢個檔案:
- ar.wikipedia.org嘅使用情況
- ast.wikipedia.org嘅使用情況
- az.wikipedia.org嘅使用情況
- ba.wikipedia.org嘅使用情況
- be-tarask.wikipedia.org嘅使用情況
- be.wikipedia.org嘅使用情況
- ca.wikipedia.org嘅使用情況
- cs.wikipedia.org嘅使用情況
- da.wikipedia.org嘅使用情況
- de.wikipedia.org嘅使用情況
- Intelligenzquotient
- Normwert
- Wikipedia:WikiProjekt Psychologie/Archiv
- Benutzer:SonniWP/Hochbegabung
- Kritik am Intelligenzbegriff
- The Bell Curve
- Benutzer:Rainbowfish/Bilder
- Quantitative Psychologie
- Intelligenzprofil
- Benutzer:LauM Architektur/Babel
- Benutzer:LauM Architektur/Babel/Überdurchschnittlicher IQ
- de.wikibooks.org嘅使用情況
- Elementarwissen medizinische Psychologie und medizinische Soziologie: Theoretisch-psychologische Grundlagen
- Elementarwissen medizinische Psychologie und medizinische Soziologie/ Druckversion
- Elementarwissen medizinische Psychologie und medizinische Soziologie/ Test
- Benutzer:OnkelDagobert:Wikilinks:Psychologie
- de.wikiversity.org嘅使用情況
- en.wikipedia.org嘅使用情況
- User:Michael Hardy
- User:Robinh
- User:Itsnotvalid
- User:M.e
- User:Quandaryus
- User:Astronouth7303
- User:Mattman723
- User:Iothiania
- User:Octalc0de
- Portal:Mathematics/Featured picture archive
- User:Dirknachbar
- User talk:BlaiseFEgan
- User:Albatross2147
- User:Klortho
- User:Kvasir
- User:Spellcheck
- User:Heptadecagram
- User:Patrick1982
- User:NeonMerlin/boxes
- User:Cswrye
睇呢個檔案嘅更多全域使用情況。
