File:Layout engine usage share-2009-01-07.svg

呢個「SVG」檔案嘅呢個「PNG」預覽嘅大細:520 × 273 像素。 第啲解像度:320 × 168 像素|640 × 336 像素|1,024 × 538 像素|1,280 × 672 像素|2,560 × 1,344 像素。
原本檔案 (SVG檔案,表面大細: 520 × 273 像素,檔案大細:36 KB)
| 描述 |
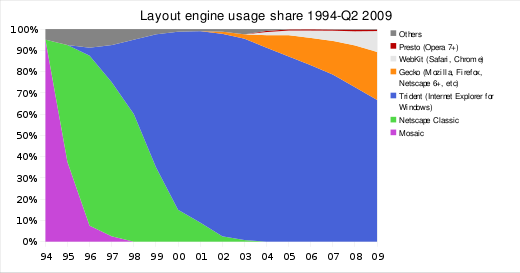
Vector version of Image:Layout_engine_usage.png on English Wikipedia. Original description: Comparison of layout engine/web browser usage share (market share) over time. Data is based on usage share of web browsers. Note that the values may contain errors. Existing problems in the current data:
Please help improving the data if you can. :-) Suggestions for future improvements:
(Original) Graph created with OpenOffice.org Calc. (Recreated in vector form in Inkscape.) The revised CSV data: "Date","Mosaic","Netscape Classic","Trident (Internet Explorer for Windows)","Gecko (Mozilla, Firefox, Netscape 6+, etc)","WebKit (Safari)","Presto (Opera 7+)","Others"
1994,95,0,0,0,0,0,5
1995,37.5,55,0,0,0,0,7.5
1996,7.5,80,3.75,0,0,0,8.75
1997,2.5,72.5,17.5,0,0,0,7.5
1998,0,60,35,0,0,0,5
1999,0,35,62.5,0,0,0,2.5
2000,0,15,83.75,0,0,0,1.25
2001,0,9,90,0,0,0,1
2002,0,2.5,95.25,1,0,0,1.25
2003,0,0.75,94.75,2,0,0,2.5
2004,0,0,92.625,4,1,0.625,1.75
2005,0,0,86.903861,9.544639,1.571667,0.7429,1.23693299999999
2006,0,0,60.65,9.5925,30.995,0.4825,0.4825
Some further notes on the data:
|
| 日期 | (UTC) |
| 來源 | |
| 作者 |
|
| This is a retouched picture, which means that it has been digitally altered from its original version. Modifications: Add in 2007-Q2 2009. The original can be viewed here: Layout engine usage share.svg:
|
我,呢份作品嘅作者,決定用以下許可發佈呢件作品:
| I, the copyright holder of this work, release this work into the public domain. This applies worldwide. In some countries this may not be legally possible; if so: I grant anyone the right to use this work for any purpose, without any conditions, unless such conditions are required by law. |
Original upload log
This image is a derivative work of the following images:
- File:Layout_engine_usage_share.svg licensed with PD-self
- 2009-02-14T11:18:01Z Qubodup 646x376 (32890 Bytes) removed chartjunk (and didn't screw up year this time)
- 2009-02-14T11:12:33Z Qubodup 646x376 (33685 Bytes) Reverted to version as of 20:05, 1 September 2006
- 2009-02-14T11:11:17Z Qubodup 646x376 (33190 Bytes) Removed chartjunk
- 2006-09-01T20:05:53Z Wereon 646x376 (33685 Bytes)
Uploaded with derivativeFX
檔案歷史
撳個日期/時間去睇響嗰個時間出現過嘅檔案。
| 日期/時間 | 縮圖 | 尺寸 | 用戶 | 註解 | |
|---|---|---|---|---|---|
| 現時 | 2009年7月1號 (三) 20:20 | | 520 × 273(36 KB) | Jars99~commonswiki | {{Information |Description=Vector version of Image:Layout_engine_usage.png on English Wikipedia. Original description: Comparison of layout engine/web browser usage share (market share) over t |
檔案用途
以下嘅1版用到呢個檔:
全域檔案使用情況
下面嘅維基都用緊呢個檔案:
- ca.wikipedia.org嘅使用情況
- de.wikipedia.org嘅使用情況
- en.wikipedia.org嘅使用情況
- eo.wikinews.org嘅使用情況
- hu.wikipedia.org嘅使用情況
- ko.wikipedia.org嘅使用情況
- ml.wikipedia.org嘅使用情況
- my.wikipedia.org嘅使用情況
- nl.wikipedia.org嘅使用情況
- zh.wikipedia.org嘅使用情況