File:Leapsecond.ut1-utc.svg

呢個「SVG」檔案嘅呢個「PNG」預覽嘅大細:600 × 480 像素。 第啲解像度:300 × 240 像素|960 × 768 像素|1,280 × 1,024 像素|2,560 × 2,048 像素。
原本檔案 (SVG檔案,表面大細: 600 × 480 像素,檔案大細:301 KB)
摘要
| 描述 |
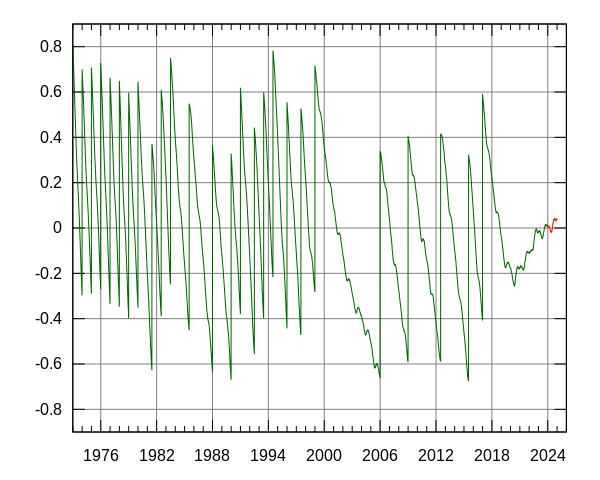
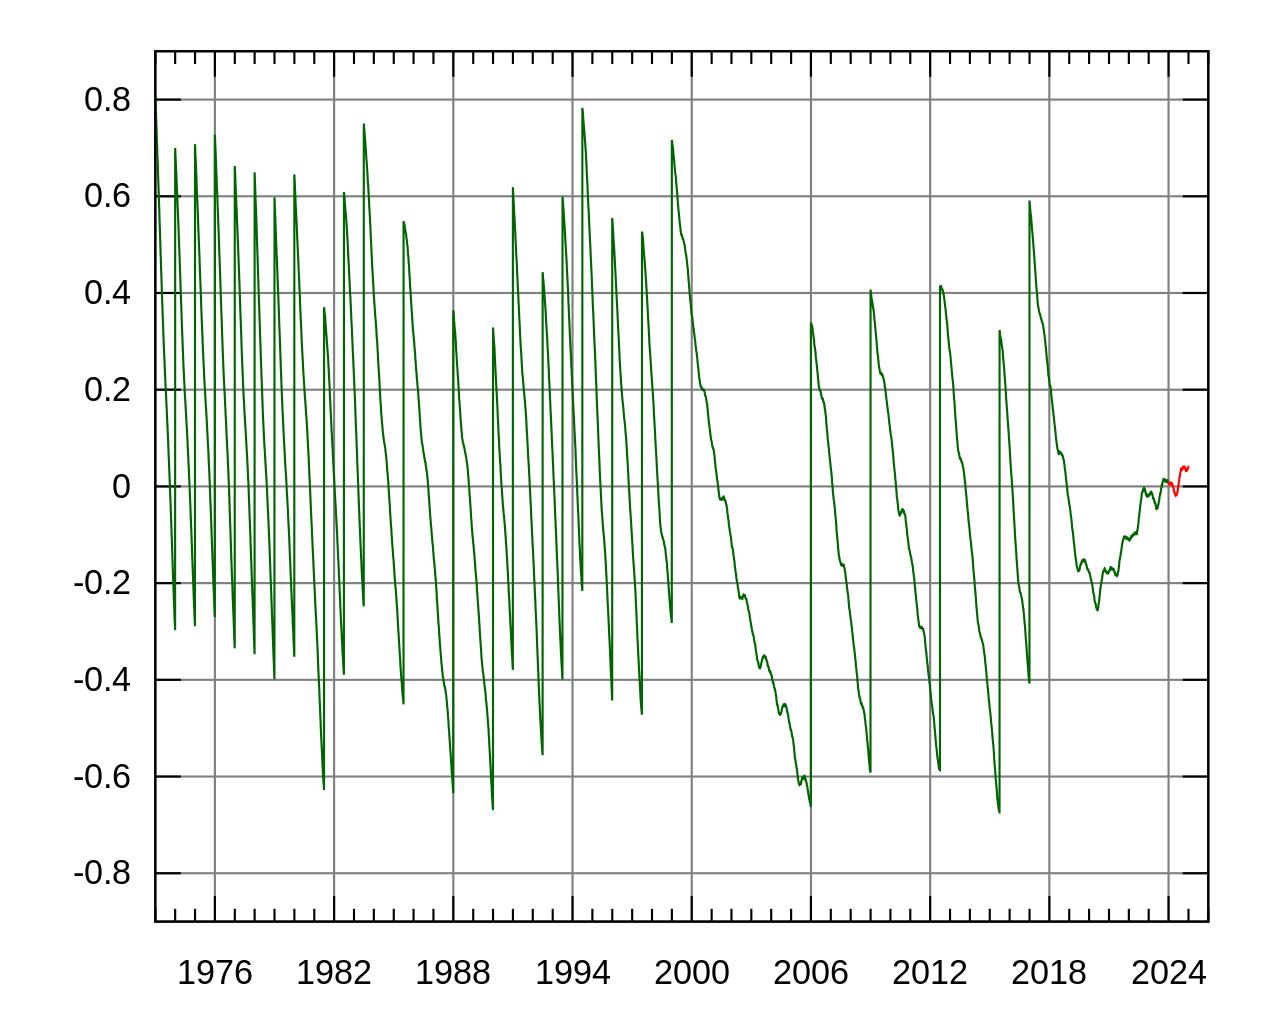
English: Plot showing the difference UT1−UTC in seconds. Vertical segments correspond to leap seconds. Red part of graph was prediction (future values) at the time the file was made.
Čeština: Graf zobrazující rozdíl UT1−UTC v sekundách. Svislé úseky odpovídají přestupným sekundám. Červená část je předpověď budoucích hodnot (v okamžiku vytvoření grafu). |
|||||
| 日期 | 2017-01-05, last update 2024-01-03 | |||||
| 來源 | Own work using: https://maia.usno.navy.mil/ser7/finals.all | |||||
| 作者 |
Tomia (傾偈 · 貢獻) Petr Kadlec (傾偈 · 貢獻) Gordon P. Hemsley (傾偈 · 貢獻) RP88 (傾偈 · 貢獻) |
|||||
| 許可 (重用呢個檔案) |
|
|||||
| Other versions |
|
|||||
| SVG genesis |


Source code
Generated using the following scripts:
wget https://maia.usno.navy.mil/ser7/finals.all

cut -c 1-2,3-4,5-6,8-15,58,59-68 --output-delimiter " " finals.all > finals-cut.txt
grep "P" finals-cut.txt > finals-pred.txt
grep "I" finals-cut.txt > finals-iers.txt

gnuplot leapsecs.gnuplot
leapsecs.gnuplot contains commands for gnuplot 5.0:
set xdata time
set timefmt "%Y-%m-%d"
set format x "%Y"
set xrange ["1973-01-01":"2026-01-01"]
set yrange [-0.9:0.9]
set grid lt 3 lc 0
set terminal svg font "Arial,16"
set style line 1 lc rgb 'dark-green' lt 1
set style line 2 lc rgb 'red' lt 1
unset key
makedate(y,m,d,j) = sprintf("%04d-%02d-%02d", (j <= 51543 ? 1900 + y : 2000 + y), m, d)
set output 'Leapsecond.ut1-utc.svg'
plot \
    'finals-iers.txt' \
        using (makedate($1,$2,$3,$4)):($6) \
        with lines linestyle 1 title 'Measured', \
    'finals-pred.txt' \
        using (makedate($1,$2,$3,$4)):($6) \
        with lines linestyle 2 title 'Predicted'
set output
檔案歷史
撳個日期/時間去睇響嗰個時間出現過嘅檔案。
| 日期/時間 | 縮圖 | 尺寸 | 用戶 | 註解 | |
|---|---|---|---|---|---|
| 現時 | 2024年1月3號 (三) 02:57 | | 600 × 480(301 KB) | RP88 | Updated to use data available as of 2024-01-03. Prediction through 2025. |
| 2023年8月4號 (五) 03:17 |  | 600 × 480(298 KB) | RP88 | Updated to use data available as of 2023-08-03. Prediction through 2024. | |
| 2022年9月30號 (五) 15:17 |  | 600 × 480(246 KB) | Mormegil | updated to current data | |
| 2022年4月1號 (五) 08:59 |  | 600 × 480(242 KB) | Mormegil | updated to current data | |
| 2021年1月4號 (一) 09:02 |  | 600 × 480(238 KB) | Mormegil | updated to current data | |
| 2020年4月29號 (三) 08:16 |  | 600 × 480(235 KB) | Mormegil | update data | |
| 2019年9月24號 (二) 14:00 |  | 600 × 480(234 KB) | Mormegil | updated to current data with prediction until 2020-09 | |
| 2019年1月23號 (三) 10:46 |  | 600 × 480(231 KB) | Mormegil | updated to current data | |
| 2018年8月13號 (一) 07:47 |  | 600 × 480(229 KB) | Mormegil | updated to current data | |
| 2017年1月5號 (四) 21:34 |  | 600 × 480(221 KB) | RP88 | Updated to use data available as of 2017-01-05, post leap second. |
檔案用途
以下嘅1版用到呢個檔:
全域檔案使用情況
下面嘅維基都用緊呢個檔案:
- ar.wikipedia.org嘅使用情況
- azb.wikipedia.org嘅使用情況
- be.wikipedia.org嘅使用情況
- ca.wikipedia.org嘅使用情況
- cs.wikipedia.org嘅使用情況
- da.wikipedia.org嘅使用情況
- el.wikipedia.org嘅使用情況
- en.wikipedia.org嘅使用情況
- es.wikipedia.org嘅使用情況
- et.wikipedia.org嘅使用情況
- fi.wikipedia.org嘅使用情況
- fr.wikipedia.org嘅使用情況
- he.wikipedia.org嘅使用情況
- hr.wikipedia.org嘅使用情況
- hu.wikipedia.org嘅使用情況
- it.wikipedia.org嘅使用情況
- ja.wikipedia.org嘅使用情況
- ko.wikipedia.org嘅使用情況
- lv.wikipedia.org嘅使用情況
- ms.wikipedia.org嘅使用情況
- no.wikipedia.org嘅使用情況
- pl.wikipedia.org嘅使用情況
- pt.wikipedia.org嘅使用情況
- ru.wikipedia.org嘅使用情況
- sd.wikipedia.org嘅使用情況
- sh.wikipedia.org嘅使用情況
- sk.wikipedia.org嘅使用情況
- sr.wikipedia.org嘅使用情況
- th.wikipedia.org嘅使用情況
- uk.wikipedia.org嘅使用情況
- ur.wikipedia.org嘅使用情況
- www.wikidata.org嘅使用情況
- zgh.wikipedia.org嘅使用情況
- zh.wikipedia.org嘅使用情況