File:Standard Normal Distribution.png

原本檔案 (5,986 × 3,700 像素,檔案大細:752 KB ,MIME類型:image/png)

|
This math image could be recreated using vector graphics as an SVG file. This has several advantages; see Commons:Media for cleanup for more information. If an SVG form of this image is already available, please upload it. After uploading an SVG, replace this template with {{vector version available|new image name.svg}}.
|
摘要
| 描述 |
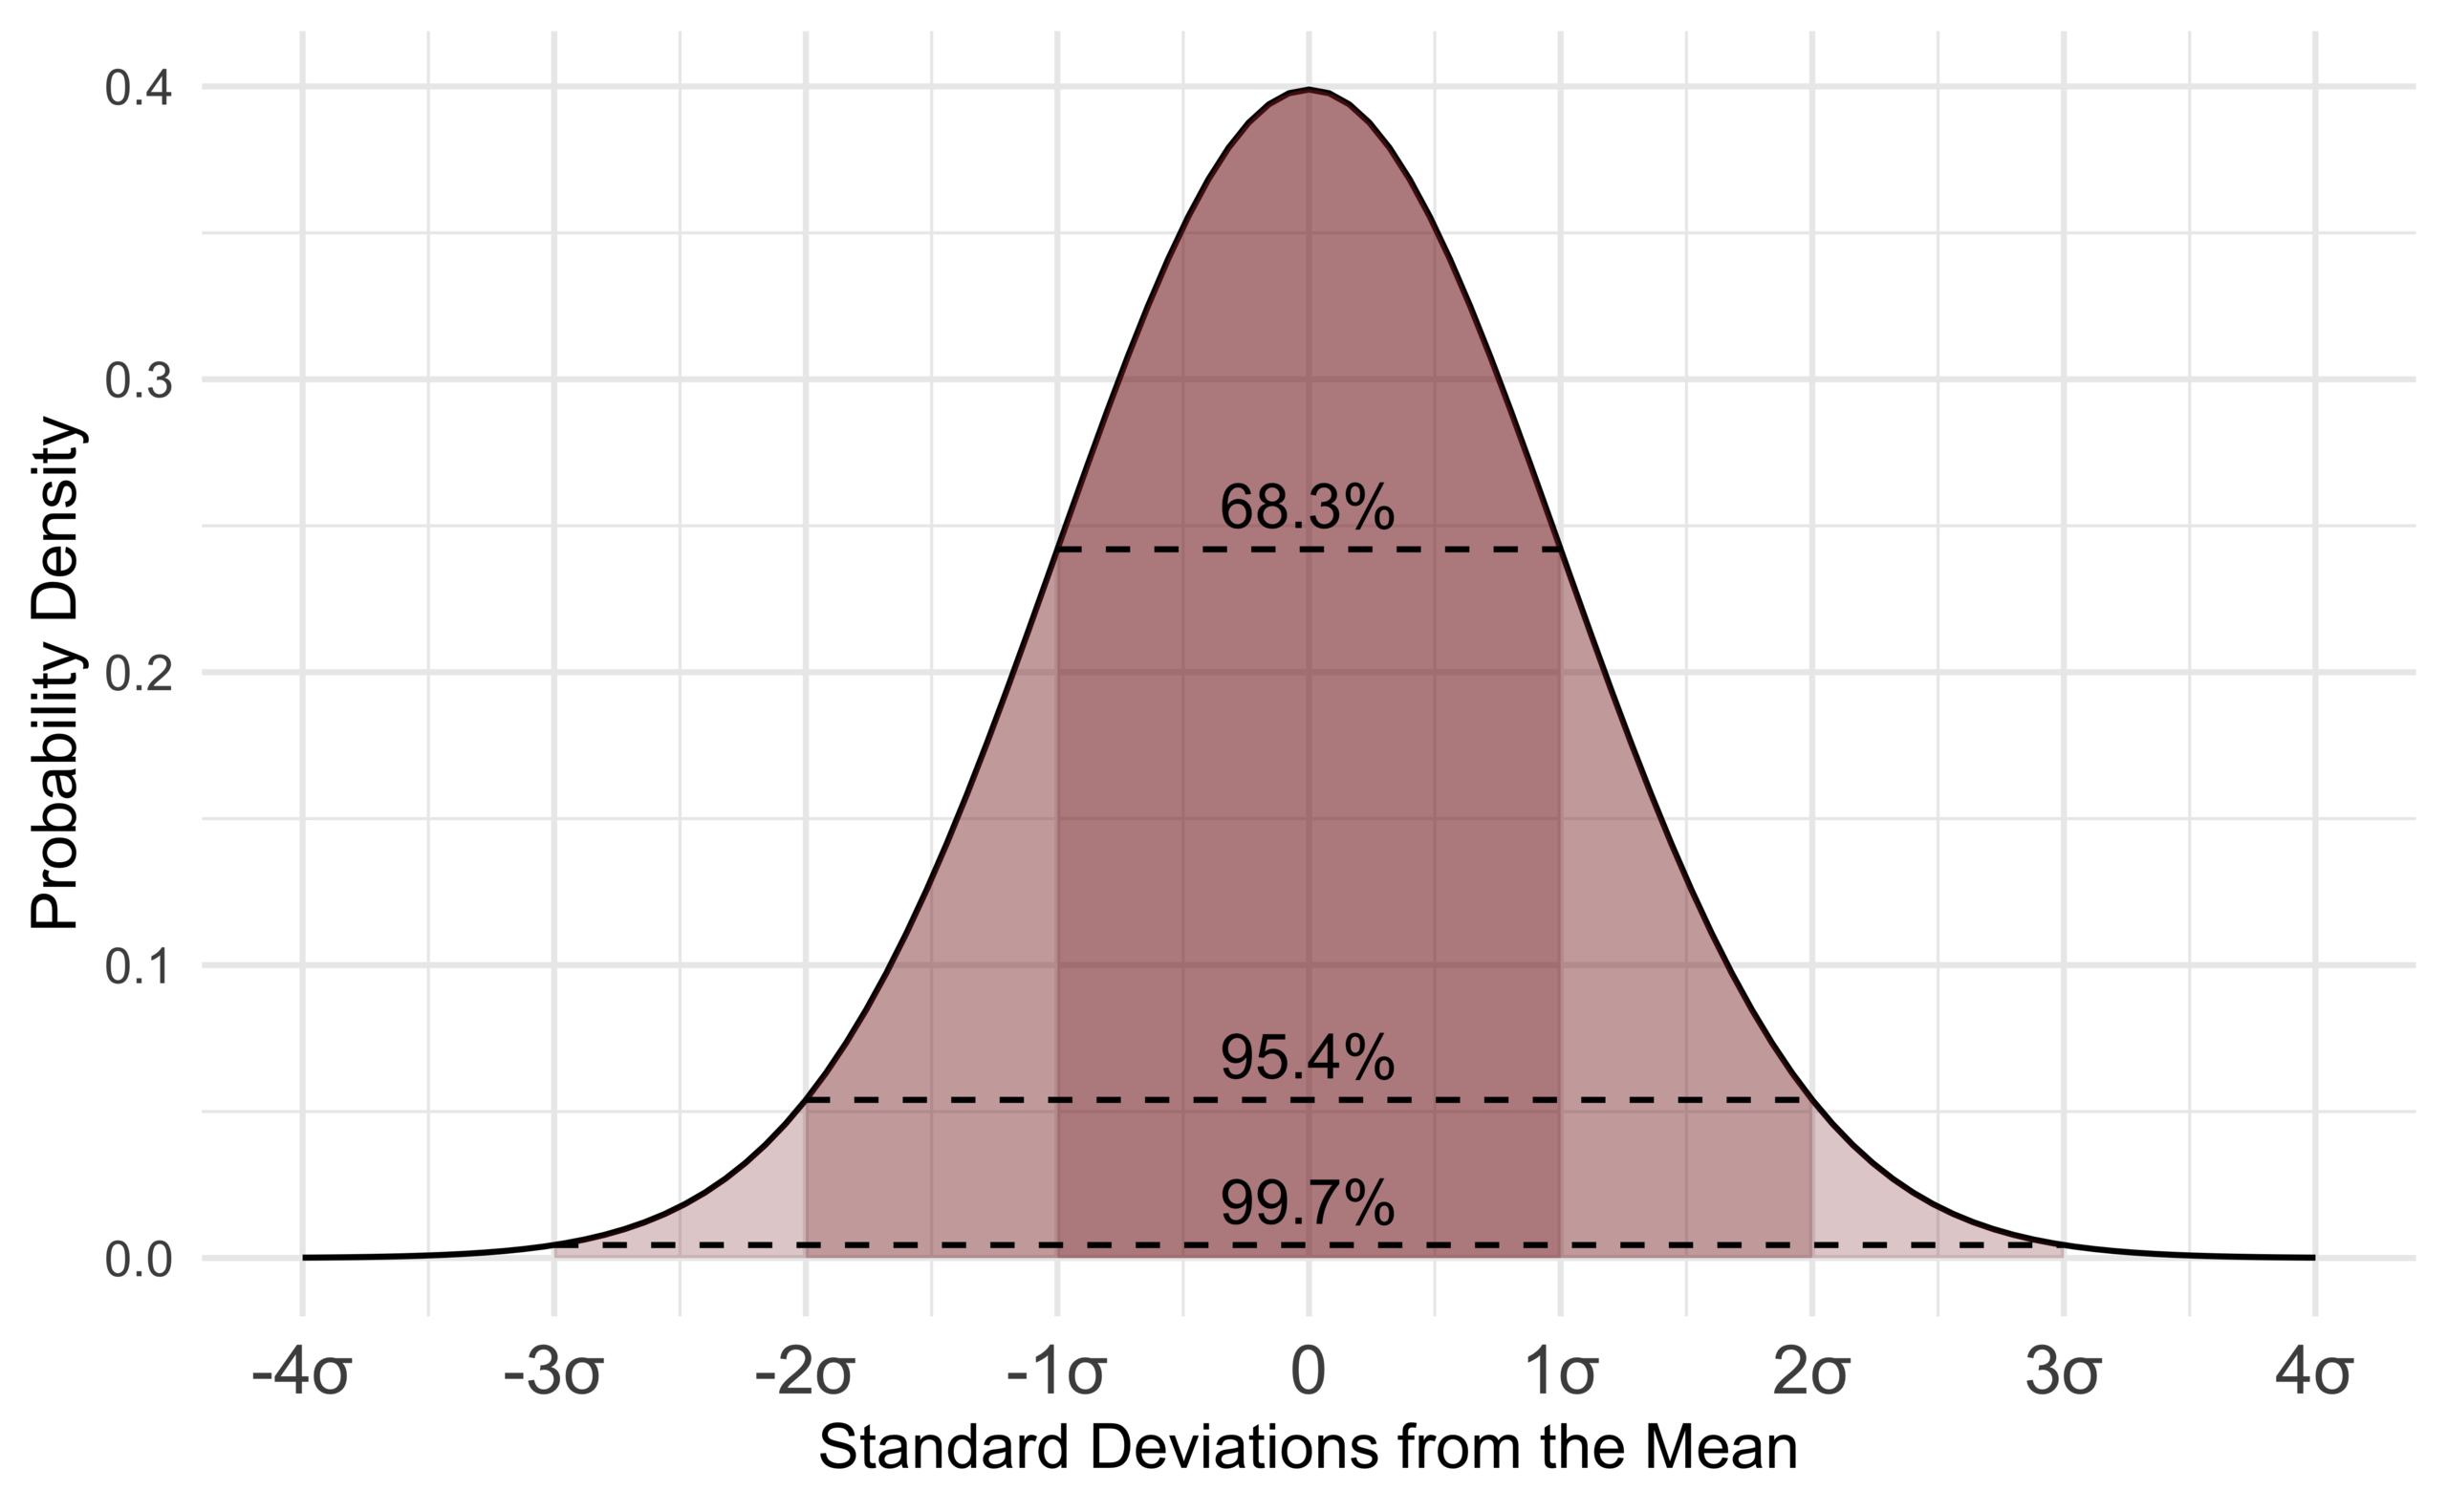
English: The Standard Normal Probability Distribution with shaded regions |
| 日期 | |
| 來源 | 自己作品 |
| 作者 | D Wells |
| Other versions |
[]
|


<code><code><code><languages/></code></code></code>
協議
我,呢份作品嘅作者,決定用以下許可發佈呢件作品:
This file is licensed under the Creative Commons Attribution-Share Alike 4.0 International license.
- 你可以:
- 去分享 – 複製、發佈同傳播呢個作品
- 再改 – 創作演繹作品
- 要遵照下面嘅條件:
- 署名 – 你一定要畀合適嘅表彰、畀返指向呢個授權條款嘅連結,同埋寫明有無改過嚟。你可以用任何合理方式去做,但唔可以用任何方式暗示授權人認可咗你或者你嘅使用方式。
- 相同方式分享 – 如果你用任何方式改過呢個作品,你必須要用返原本或者相似嘅條款發佈。
Source code
library(ggplot2)
p <- ggplot(NULL, aes(c(-4,4))) +
  geom_line(stat = "function", fun = dnorm) +
  geom_area(stat = "function", fun = dnorm, fill = scales::muted("blue"), xlim=c(-1,1), alpha=1/4) +
  geom_area(stat = "function", fun = dnorm, fill = scales::muted("blue"), xlim=c(-2,2), alpha=1/4) +
  geom_area(stat = "function", fun = dnorm, fill = scales::muted("blue"), xlim=c(-3,3), alpha=1/4) +
  theme_minimal() +
  theme(axis.text.x = element_text(size = 12)) +
  scale_x_continuous(labels = label_units, breaks = -4:4) +
  xlab("Standard Deviations from the Mean") +
  ylab("Probability Density") +
  geom_segment(aes(x=-1, xend=1, y=dnorm(1), yend=dnorm(1)), linetype="dashed") +
  geom_segment(aes(x=-2, xend=2, y=dnorm(2), yend=dnorm(2)), linetype="dashed") +
  geom_segment(aes(x=-3, xend=3, y=dnorm(3), yend=dnorm(3)), linetype="dashed") +
  annotate("text", x = 0, y = dnorm(1)+0.015, label = "68.3%") + #pnorm(1)-pnorm(-1) %
  annotate("text", x = 0, y = dnorm(2)+0.015, label = "95.4%") +
  annotate("text", x = 0, y = dnorm(3)+0.015, label = "99.7%")

ggsave("Normal_Distribution.png", p, width = 3.7*1.618, height = 3.7, dpi = 1000)
檔案歷史
撳個日期/時間去睇響嗰個時間出現過嘅檔案。
| 日期/時間 | 縮圖 | 尺寸 | 用戶 | 註解 | |
|---|---|---|---|---|---|
| 現時 | 2019年6月24號 (一) 18:25 | | 5,986 × 3,700(752 KB) | D Wells | User created page with UploadWizard |
檔案用途
以下嘅3版用到呢個檔:
全域檔案使用情況
下面嘅維基都用緊呢個檔案:
- ar.wikipedia.org嘅使用情況
- ast.wikipedia.org嘅使用情況
- as.wikipedia.org嘅使用情況
- az.wikipedia.org嘅使用情況
- bcl.wikipedia.org嘅使用情況
- bg.wikipedia.org嘅使用情況
- bn.wikipedia.org嘅使用情況
- br.wikipedia.org嘅使用情況
- cbk-zam.wikipedia.org嘅使用情況
- cy.wikipedia.org嘅使用情況
- el.wikipedia.org嘅使用情況
- en.wikipedia.org嘅使用情況
- eo.wikiquote.org嘅使用情況
- frr.wikipedia.org嘅使用情況
- fr.wikipedia.org嘅使用情況
- haw.wikipedia.org嘅使用情況
- ia.wikipedia.org嘅使用情況
- incubator.wikimedia.org嘅使用情況
- it.wikipedia.org嘅使用情況
- ja.wikipedia.org嘅使用情況
- kab.wikipedia.org嘅使用情況
- kl.wikipedia.org嘅使用情況
- ku.wikipedia.org嘅使用情況
- my.wikipedia.org嘅使用情況
- qu.wikipedia.org嘅使用情況
- ru.wikipedia.org嘅使用情況
- simple.wikipedia.org嘅使用情況
- sq.wikipedia.org嘅使用情況
- tl.wikipedia.org嘅使用情況
- tr.wikipedia.org嘅使用情況
- tum.wikipedia.org嘅使用情況
- www.wikidata.org嘅使用情況
- zu.wikipedia.org嘅使用情況