File:OECD Social Expenditure by Braunch.svg

呢個「SVG」檔案嘅呢個「PNG」預覽嘅大細:800 × 400 像素。 第啲解像度:320 × 160 像素|640 × 320 像素|1,024 × 512 像素|1,280 × 640 像素|2,560 × 1,280 像素|1,260 × 630 像素。
原本檔案 (SVG檔案,表面大細: 1,260 × 630 像素,檔案大細:196 KB)

|
This file may be updated to reflect new information. If you wish to use a specific version of the file without new updates being mirrored, please upload the required version as a separate file. |
摘要
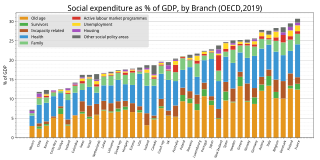
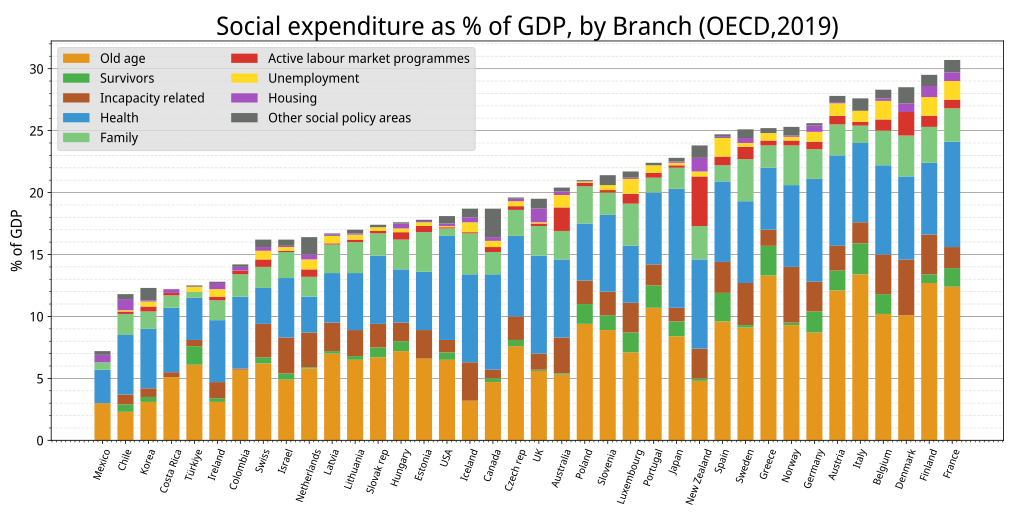
| 描述 | Social Expenditure as % of GDP by Braunch, (OECD 2019) |
| 日期 | |
| 來源 |
自己作品, Data from OECD SOCX https://stats.oecd.org/Index.aspx?DataSetCode=SOCX_AGG |
| 作者 | Yuasan |
| 許可 (重用呢個檔案) |
CC-0 |
協議
我,呢份作品嘅作者,決定用以下許可發佈呢件作品:
| This file is made available under the Creative Commons CC0 1.0 Universal Public Domain Dedication. | |
| The person who associated a work with this deed has dedicated the work to the public domain by waiving all of their rights to the work worldwide under copyright law, including all related and neighboring rights, to the extent allowed by law. You can copy, modify, distribute and perform the work, even for commercial purposes, all without asking permission.
|
Graph data
import numpy as np
from cycler import cycler
import matplotlib.pyplot as plt
import pandas as pd

df = pd.read_csv("data.tsv", index_col=0 , sep = "\t")
df = df.sort_values(by=["Total"], ascending=True).fillna(0)
df1 = df.drop('Total', axis=1).T

#plt.rcParams["axes.prop_cycle"] = plt.cycler("color", plt.get_cmap("tab20")(np.linspace(0,1,12)))
plt.rcParams['axes.prop_cycle'] = cycler(color=['#e5961d', '#4DAF4A', '#B15928', '#3b95d3', '#7FC97F', '#d7352b', '#ffd924', '#a652c1', '#686d69'])

fig, ax = plt.subplots(figsize=(14, 7))
for i in range( len(df1) ):
	ax.bar(df1.columns, df1.iloc[i] , width=0.7, bottom=df1.iloc[:i].sum())

ax.legend(df.columns, fontsize=13,  loc='upper left', ncol=2,  frameon=True, facecolor="#dddddd")
ax.set_axisbelow(True)

plt.rcParams['font.family'] = 'sans-serif'
plt.rcParams['font.sans-serif'] = ['Noto Sans Display']
plt.subplots_adjust(left=0.05, bottom=0.14, right=0.98, top=0.92)

plt.title("Social expenditure as % of GDP, by Branch (OECD,2019)", fontsize=25)
plt.tick_params(labelsize=10, pad=4)

plt.xticks(df.index, rotation=70, size=10)
plt.yticks(fontsize=13)
plt.ylabel("% of GDP", size=15)

ax.minorticks_on()
plt.grid(which='major',color='#999999',linestyle='-', axis="y")
plt.grid(which='minor',color='#e3e3e3',linestyle='--', axis="y")

plt.savefig("image.svg")
檔案歷史
撳個日期/時間去睇響嗰個時間出現過嘅檔案。
| 日期/時間 | 縮圖 | 尺寸 | 用戶 | 註解 | |
|---|---|---|---|---|---|
| 現時 | 2023年2月24號 (五) 14:56 | | 1,260 × 630(196 KB) | Yuasan | 2019 data |
| 2021年7月13號 (二) 09:53 |  | 1,440 × 720(153 KB) | Yuasan | 2017 data | |
| 2015年11月30號 (一) 08:22 |  | 735 × 416(139 KB) | Yuasan | 2011 | |
| 2014年5月6號 (二) 01:41 |  | 746 × 438(106 KB) | Yuasan | User created page with UploadWizard |
檔案用途
以下嘅1版用到呢個檔:
全域檔案使用情況
下面嘅維基都用緊呢個檔案:
- en.wikipedia.org嘅使用情況
- eo.wikipedia.org嘅使用情況
- ja.wikipedia.org嘅使用情況
- ko.wikipedia.org嘅使用情況
- la.wikipedia.org嘅使用情況
- th.wikipedia.org嘅使用情況
- tr.wikipedia.org嘅使用情況