File:Phase-diag.svg

呢個「SVG」檔案嘅呢個「PNG」預覽嘅大細:575 × 443 像素。 第啲解像度:312 × 240 像素|623 × 480 像素|997 × 768 像素|1,280 × 986 像素|2,560 × 1,972 像素。
原本檔案 (SVG檔案,表面大細: 575 × 443 像素,檔案大細:16 KB)
| 描述 |
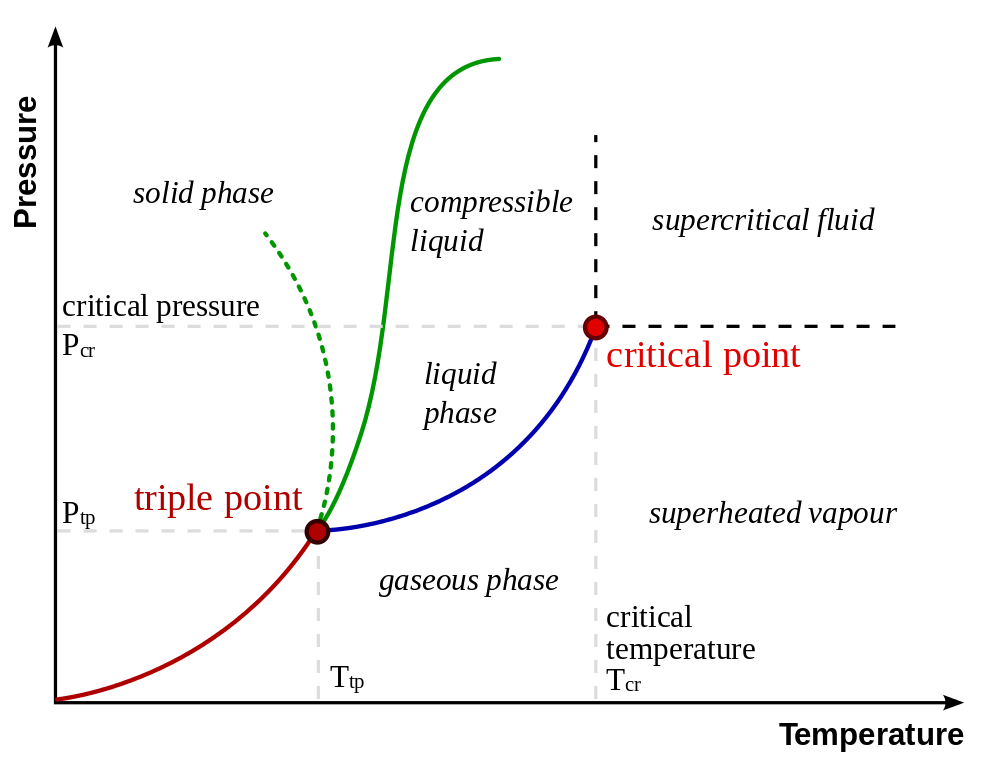
Deutsch: Ein typisches Phasendiagramm für ein einzelnes Material, die feste, flüssige und gasförmige Phase herausstellend. Die durchgezogene grüne Linie zeigt die übliche Form einer flüssig-fest-Phasen-Linie. Die gepunktete grüne Linie zeigt das anomale Verhalten von Wasser.
English: A typical phase diagram for a single-component material, exhibiting solid, liquid and gaseous phases. The solid green line shows the usual shape of the liquid-solid phase line. The dotted green line shows the anomalous behavior of water. |
||||||||
| 日期 | |||||||||
| 來源 | SVG conversion from raster image Image:Phase-diag.png; some additions from Image:Phase diagram.png | ||||||||
| 作者 | Maksim; vector version by Booyabazooka | ||||||||
| 許可 (重用呢個檔案) |
Maksim, the copyright holder of this work, hereby publishes it under the following license:
|
||||||||
| Other versions |
Derivative works of this file: []
With a more realistic melting curve for ice:
|


檔案歷史
撳個日期/時間去睇響嗰個時間出現過嘅檔案。
| 日期/時間 | 縮圖 | 尺寸 | 用戶 | 註解 | |
|---|---|---|---|---|---|
| 現時 | 2007年2月25號 (日) 15:11 | | 575 × 443(16 KB) | EnEdC | Add over-critical labels from Image:Phase diagram.png |
| 2006年6月8號 (四) 07:28 |  | 575 × 398(12 KB) | Chris-martin |
檔案用途
無嘢連來呢份檔案。
全域檔案使用情況
下面嘅維基都用緊呢個檔案:
- be.wikipedia.org嘅使用情況
- bg.wikipedia.org嘅使用情況
- bs.wikipedia.org嘅使用情況
- et.wikipedia.org嘅使用情況
- fi.wikipedia.org嘅使用情況
- hi.wikipedia.org嘅使用情況
- hr.wikipedia.org嘅使用情況
- id.wikipedia.org嘅使用情況
- ksh.wikipedia.org嘅使用情況
- nn.wikipedia.org嘅使用情況
- pt.wikipedia.org嘅使用情況
- ro.wikipedia.org嘅使用情況
- sh.wikipedia.org嘅使用情況
- sr.wikipedia.org嘅使用情況
- tr.wikipedia.org嘅使用情況
- uk.wikipedia.org嘅使用情況
- ur.wikipedia.org嘅使用情況