File:ProvincialGDPofPRC.png
原本檔案 (6,804 × 4,937 像素,檔案大細:481 KB ,MIME類型:image/png)


|
This image is expected to always be the most recent one. Feel free to update it when needed.
|

|
This file may be updated to reflect new information. If you wish to use a specific version of the file without new updates being mirrored, please upload the required version as a separate file. |
摘要
| 描述 |
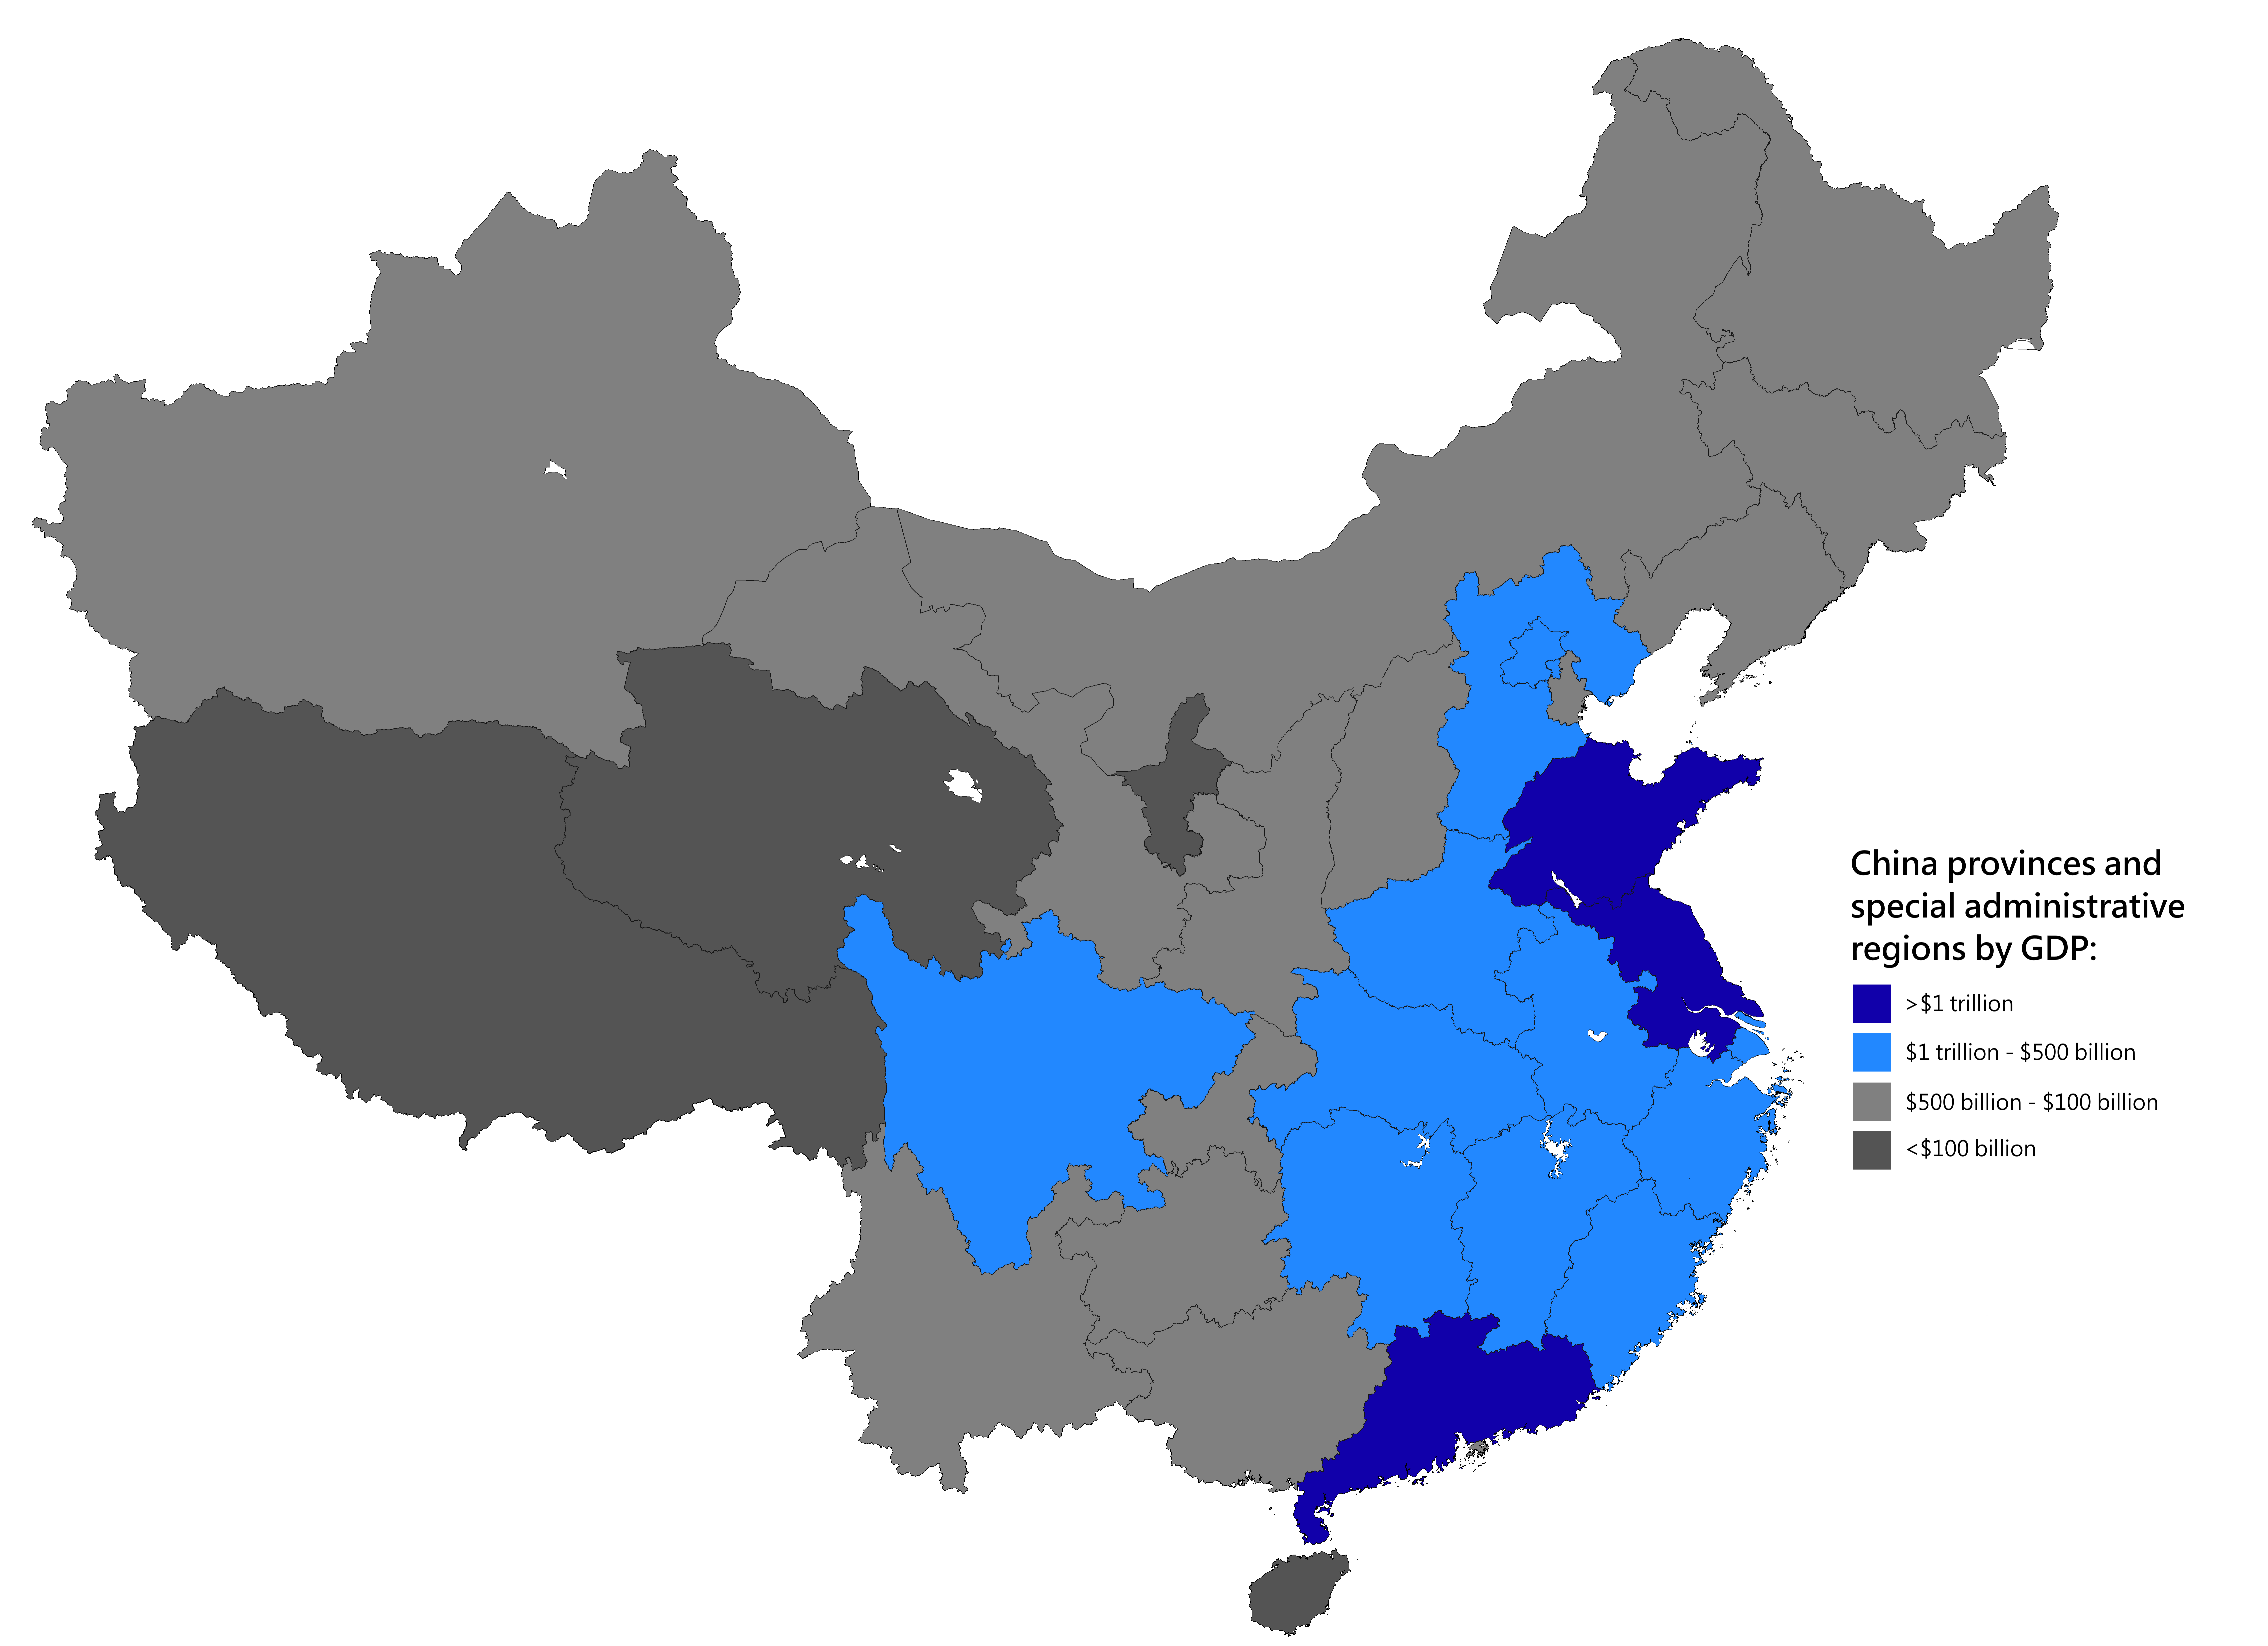
English: Map of Chinese provinces by Gross domestic product in United States dollars (2020)
日本語: 米ドルでの国内総生産による中国の州の地図(2020年)
Русский: Карта провинций Китая по валовому внутреннему продукту в долларах США (2020)
Монгол: АНУ-ын долларын дотоодын нийт бүтээгдэхүүнээр Хятадын мужуудын газрын зураг (2020)
中文(简体):按美元国内生产总值划分的中国省份地图 (2020) (包含未實際控制之疆域)
中文(繁體):按美元國內生產總值劃分的中國省份地圖 (2020) (包含未實際控制之疆域) |
||
| 日期 |
|
||
| 來源 |
Legend color for GDP: >$1 trillion
$1 trillion - $500 billion
$500 billion - $100 billion
<$100 billion
Source appearance:
|
||
| 作者 |
|
||
| 許可 (重用呢個檔案) |
Map of China, administrative divisions: 我,呢份作品嘅作者,決定用以下許可發佈呢件作品:
|
.png)
協議
我,呢份作品嘅作者,決定用以下許可發佈呢件作品:
This file is licensed under the Creative Commons Attribution-Share Alike 4.0 International license.
- 你可以:
- 去分享 – 複製、發佈同傳播呢個作品
- 再改 – 創作演繹作品
- 要遵照下面嘅條件:
- 署名 – 你一定要畀合適嘅表彰、畀返指向呢個授權條款嘅連結,同埋寫明有無改過嚟。你可以用任何合理方式去做,但唔可以用任何方式暗示授權人認可咗你或者你嘅使用方式。
- 相同方式分享 – 如果你用任何方式改過呢個作品,你必須要用返原本或者相似嘅條款發佈。

|
This locator map image could be recreated using vector graphics as an SVG file. This has several advantages; see Commons:Media for cleanup for more information. If an SVG form of this image is already available, please upload it. After uploading an SVG, replace this template with {{vector version available|new image name.svg}}.
|
|
|
This map image could be recreated using vector graphics as an SVG file. This has several advantages; see Commons:Media for cleanup for more information. If an SVG form of this image is already available, please upload it. After uploading an SVG, replace this template with {{vector version available|new image name.svg}}.
|
檔案歷史
撳個日期/時間去睇響嗰個時間出現過嘅檔案。
| 日期/時間 | 縮圖 | 尺寸 | 用戶 | 註解 | |
|---|---|---|---|---|---|
| 現時 | 2021年12月28號 (二) 03:50 | | 6,804 × 4,937(481 KB) | Maanshen | Update new map and 2020 data |
| 2018年12月18號 (二) 02:47 |  | 4,773 × 3,516(632 KB) | Radom1967 | cropped | |
| 2018年9月25號 (二) 13:18 |  | 5,000 × 3,520(1.15 MB) | Radom1967 | Updated to 2017 data | |
| 2015年3月8號 (日) 16:59 |  | 901 × 1,086(53 KB) | Cncs wikipedia | renew | |
| 2013年9月3號 (二) 02:36 |  | 901 × 1,086(35 KB) | Cncs wikipedia | renew | |
| 2013年7月26號 (五) 07:33 |  | 901 × 1,090(36 KB) | Cncs wikipedia | repainting | |
| 2011年5月31號 (二) 03:33 |  | 901 × 1,090(34 KB) | Cncs wikipedia | == {{int:filedesc}} == {{Information |Description=中国各省份GDP总量分布 GDP of Chinese province-level divisions in 2008 |Source=自制 |Date=2011-05-31 |Author=zh:User:cncs wikipedia |Permission=PD |other_versions=no }} == {{int:license}} = | |
| 2011年5月30號 (一) 17:38 |  | 901 × 1,090(61 KB) | Cncs wikipedia | == {{int:filedesc}} == {{Information |Description=中国各省份GDP总量分布 GDP of Chinese province-level divisions in 2008 |Source=自制 |Date=2011-05-30 |Author=zh:User:cncs wikipedia |Permission=PD |other_versions=no }} == {{int:license}} = | |
| 2011年5月30號 (一) 03:31 |  | 900 × 794(74 KB) | Tranletuhan | Reverted to version as of 17:04, 20 June 2009 | |
| 2011年5月27號 (五) 10:18 |  | 901 × 1,090(32 KB) | Cncs wikipedia | == {{int:filedesc}} == {{Information |Description=中国各省份GDP总量分布 GDP of Chinese province-level divisions in 2010 |Source=自制 |Date=2011-05-27 |Author=zh:User:cncs wikipedia |Permission=PD |other_versions=no }} == {{int:license}} = |
檔案用途
全域檔案使用情況
下面嘅維基都用緊呢個檔案:
- da.wikipedia.org嘅使用情況
- fi.wikipedia.org嘅使用情況
- fr.wikipedia.org嘅使用情況
- ja.wikipedia.org嘅使用情況
- zh.wikipedia.org嘅使用情況